An AI system should finish a task with an answer and a record of the work behind it. That record should cover successes and failures, human corrections, and what changed after an action. The experience could then improve the tools, policies, and workflows the system brings to its next task.
At Octer, we study recursive self-improvement (RSI): whether experience can improve the process a system uses to improve itself. A better answer is one part of that work. Deciding which failure to investigate or which candidate to test can matter just as much, as can knowing when to collect more evidence.
The autonomous experimentation system moves from hypotheses through experiments and outcome validation, passing useful methods to successor versions. Its reasoning comes from foundation models. The runtime uses accumulated experience to guide how it applies that reasoning within an organization.
We evaluate the system in three settings. Engineering tasks have executable correctness checks; scientific computing tests generalization explicitly. Commercial decisions require evidence and must respect operational constraints. A separate meta-improvement study examines whether the improver itself becomes more efficient.
STUDY COMPARISON
| Study | Task and metric | Baseline | Octer | Difference |
|---|---|---|---|---|
| EngineeringENG-PASS | Audit pass rate across 180 tasks × 5 replicates | Fixed reflective search 72.44%652 / 900 outcomes | 79.67%717 / 900 outcomes | +7.22 percentage points |
| Scientific computingSCI-PASS | Both error thresholds met across 80 problems × 5 replicates | Fixed reflective search 40.75%163 / 400 outcomes | 50.25%201 / 400 outcomes | +9.50 percentage points |
| Commercial decisionsCOM-PASS | Complete-decision pass rate across 200 scenarios × 5 replicates | Fixed reflective search 71.10%711 / 1000 outcomes | 79.70%797 / 1000 outcomes | +8.60 percentage points |
| Meta-improvement | Capped mean evaluations to reach an adaptation-validation threshold | M0 171.98 evaluations | M2 112.63 evaluations | 34.51% fewer; 54/60 → 57/60 reach threshold |
Scroll the table horizontally to view every column.
Percentages and differences are calculated from unrounded counts, then rounded separately. ENG-PASS and COM-PASS use different tasks and criteria. Similar displayed values do not imply the same metric or equivalent capability.
In each of the first three studies, five system/run replicates cover every task in that domain, with replicate indices paired across methods. ENG-PASS, SCI-PASS, and COM-PASS each identify one result, even when it appears in several places. Those repeated appearances are not independent confirmations. The meta study has its own adaptation records.
A runtime that can inherit experience
The harness is the layer that organizes models, tools, skills, policies, workflows, and memory. Through it, the model receives evidence, breaks down goals, and responds to tool failures. Changes that persist in the harness can alter later behavior without changing foundation-model weights.
The learning engine reconstructs trajectories and selects problems to work on, then generates changes to the harness and organizes their validation. The meta-improver refines how the engine chooses examples, diagnoses failures, and allocates experimental effort. For every version we retain, we should also keep the originating experience, the changes and their validation record, and the conditions under which the version applies.
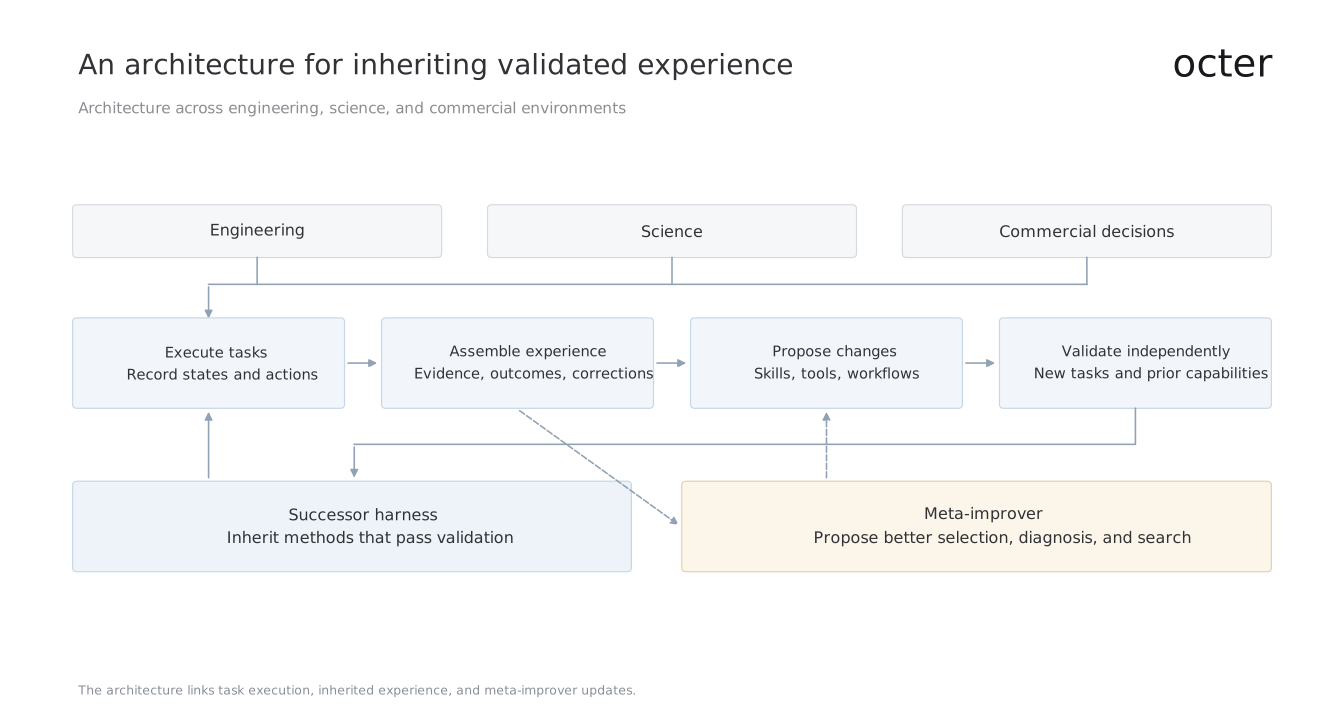
The architecture connects task execution, experience, candidate changes, independent validation, and successor versions. Dashed paths indicate meta-improver proposals.
The architecture brings advertising task and tool traces together with historical reconstruction and replay, text-based experience, candidate skills, paired checks, and version inheritance. Each component has a distinct role in turning observations from a task into a reusable method.
What evolves, and what stays separate
Instructions, executable skills, and tool wrappers are all open to change, along with workflow routing, recovery logic, and memory policies. A successor may use a candidate change only after it passes validation.
Customer facts and temporary constraints need isolated memory that can be updated. Stable preferences should stay separate from general methods. Personalizing a choice through preference adaptation is a different job from predicting environmental changes through domain modeling; each needs its own evidence.
The improver has no unrestricted editing access to the external objective, action permissions, sealed audit, or final acceptance boundary.
Case study 1: Engineering tasks
Engineering gives us a starting point with relatively direct checks. A query must retrieve all required data, and a transformation must meet its output contract. For a recovery path, we can check whether it preserves the original scope. These tests give more precise feedback than a general judgment of answer quality.
The suite covers queries and transformations, tool composition, pagination and evidence, error recovery, and constraint handling. Separate tasks serve development, version selection, and the final audit. The audit set has 180 tasks. Splits keep template and source groups together so that near-duplicates cannot leak between partitions.
We compare a fixed agent, an agent that retrieves experience, a fixed reflective search process, and the full system. All adaptive conditions have the same optimization ceiling and access to the same model and tool capabilities. Inference limits are fixed separately, and resource accounting keeps budget ceilings distinct from usage.
These controls let us compare fixed execution with experience retrieval that makes no executable updates, reflective search whose improvement procedure stays frozen, and validated experience inheritance. Reflective search and the full system can edit the same things. The meta-improver remains fixed throughout the three domain studies; changes to the improver belong to the separate meta study.
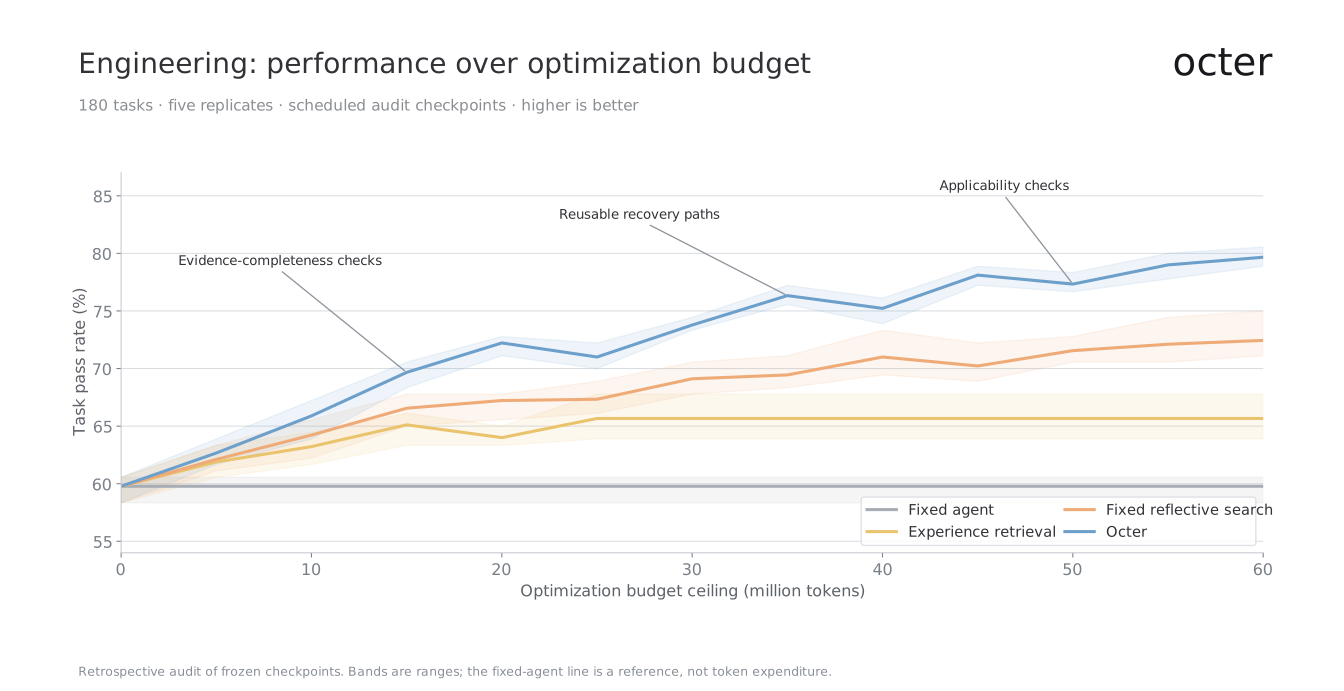
Audit-checkpoint pass rates on 180 task slots. Bands are min–max across five replicates, not confidence intervals. The audit protocol evaluates predeclared, frozen checkpoints after search finishes. The final Octer point reuses ENG-PASS (79.67%). Lines connect checkpoints; intermediate task outcomes are not supplied. Annotations identify mechanisms to investigate.
The fixed agent scores 59.78%, experience retrieval 65.67%, and fixed reflective search 72.44%. The full system reaches 79.67%, a difference of 7.22 percentage points from reflective search. Relative to that baseline’s failure rate, this amounts to 26.21% fewer failures.
ENG-PASS counts 717 passing outcomes out of 900 across 180 tasks × five replicates. The same result appears at the end of Figure 2, in the full-system bar in Figure 3, and as the engineering control in Figure 7. Curves show budget ceilings. The fixed-agent line should not be read as evidence that the agent spent that budget.
Progress is uneven across the trajectory. Some checkpoints can score worse on an independent audit even when development results favored the version. Sampling variation, negative transfer, and changes that apply too broadly are possible explanations. Showing only favorable checkpoints would conceal these regressions.
Starting from a weaker harness gives a different trajectory: 44.33% initially and 77.00% at the end, below the stronger harness’s 79.67% endpoint. This comparison tests how much the starting point matters to search. It cannot establish independent rediscovery of techniques the underlying model may already know.
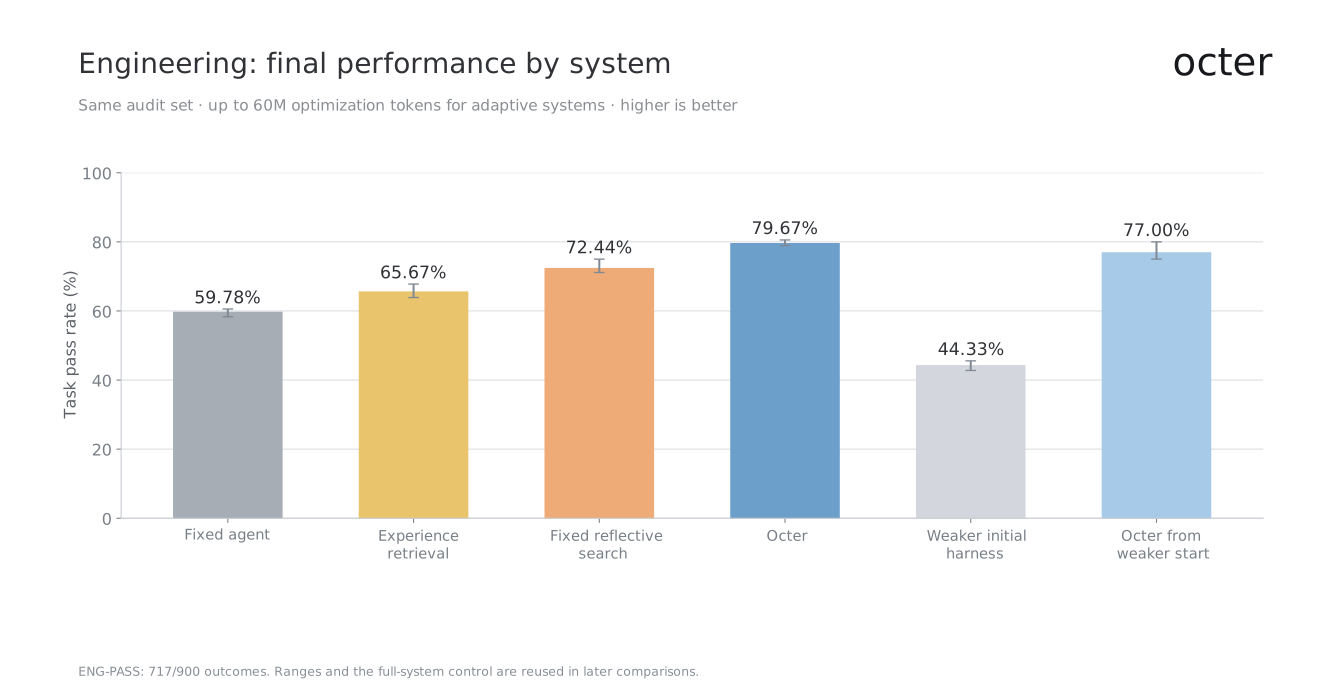
Final comparisons on the same audit set. ENG-PASS reuses the Figure 2 endpoint; these are two views of the same outcomes. Error bars show replicate ranges. The weaker-start condition changes only the initial harness.
We examine checks that require complete evidence before a conclusion, and recovery paths saved as callable skills. Each inherited method also carries preconditions and failure boundaries.
Example mechanism: an evidence-completeness contract
A pagination call can succeed before the relevant dataset has been read in full. Before allowing a conclusion, the skill reconciles the number of groups retrieved with the declared total and the next-page state.
Purpose: decide only after required evidence is complete
Preconditions: target scope, data cutoff, required reports
Procedure: read pages; preserve missingness; verify citations
Stop: required evidence is unavailable, or budget is exhausted
Record: source trajectory, applicable tasks, accepted version
Recovery starts by identifying the kind of failure: an invalid parameter, an unavailable date window, a missing capability, or another cause. A retry or revised query should stay within the user’s intended scope. This is the mechanism the contract tests.
Audits of individual tasks connect the performance differences to retained changes, helping us assess which capabilities carry forward from experience.
Case study 2: Scientific computing
In scientific computing, the system must execute known procedures and run calculations. It also has to propose explanations and examine whether a result holds beyond the conditions in which it was developed.
Our scientific study uses reproducible equation-discovery tasks. Public tasks and evaluation code for this area are available through LLM-SRBench. The 80 problems here form a separate evaluation and must not be attributed to that benchmark.
The problems cover oscillatory systems, reaction kinetics, growth models, and parameterized responses. To pass, a candidate must meet both normalized mean squared error thresholds: at most 10−4 on unseen in-range samples and 10−2 in a predefined extrapolation region. Expression complexity and dimensional consistency need separate review, as do domain constraints.
What the scientific score measures
For each evaluation region, NMSE divides mean squared prediction error by the target variance plus a fixed numerical stabilizer. The region boundaries, normalization, and stabilizer must be fixed before evaluation.
The data includes NMSE values but no predictions or target samples. We can therefore check pass flags against the two thresholds, although we cannot independently recalculate the errors from observations. The plotted pass rate covers those numerical thresholds alone. Complexity, units, and physical validity need separate checks.
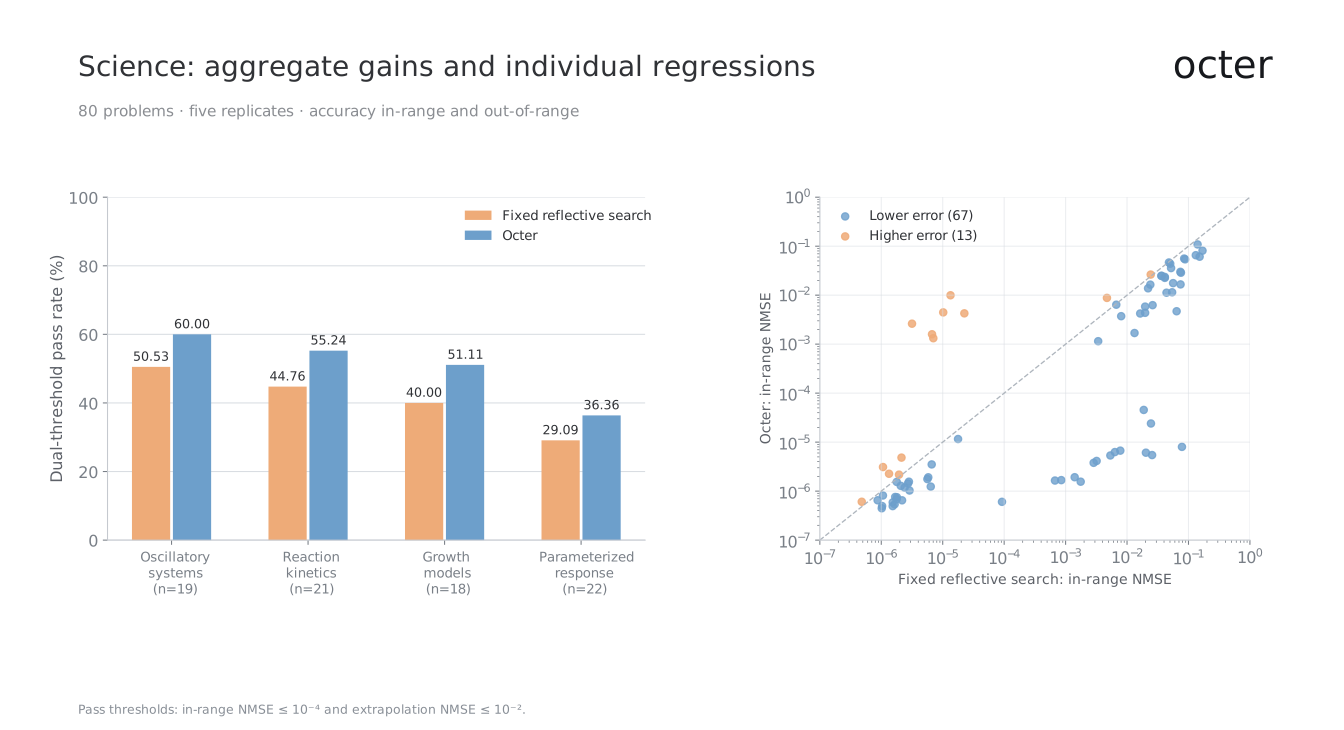
Left: dual-threshold pass rates by family, with distinct problem counts n. Pooling their numerators and denominators gives SCI-PASS. Right: each problem’s median in-range error across five replicates; points above the diagonal regress. This counts problems, not passed task–replicate outcomes.
Fixed reflective search passes both thresholds at a rate of 40.75%, compared with 50.25% for the full system. Performance differs across problem families: parameterized responses reach only 36.36%. Median in-range error falls on 67 individual problems and rises on 13. The higher aggregate score still includes those regressions.
SCI-PASS is 201/400 outcomes across task-replicate pairs. The scatter plot counts 67 problems with lower error, which is a different unit. A lower error may still miss a threshold, and improvement within the sample range does not establish success in extrapolation.
Here we examine whether residual structure helps choose the next hypothesis family, while keeping structurally different explanations in play early in the search. Numerical conditioning also needs checking, and a good in-range fit still needs an extrapolation test.
Separate broader applicability from cross-domain transfer
An engine’s applicability to engineering and science tells us something different from whether learning transfers between them. Assessing transfer from engineering to science requires a separate comparison of retained methods against a clean start, with matched resources and no target-task answers carried over.
We report no transfer score here. Numerical fit and execution in multiple domains are insufficient on their own to establish a new scientific law or transferable research knowledge. Such claims need appropriate independent data, uncertainty analysis, and replication.
Case study 3: Commercial decisions
In Octer’s advertising work, feedback arrives at different times. An intervention may change traffic quickly, while conversions take longer to mature. Inventory, prices, promotions, and other actions can change the observations too. The work therefore continues beyond the first recommendation.
We collect these observations in a decision episode, recording the prior state, hypothesis, and action alongside later observation windows, human corrections, and possible confounders. Before an episode can yield a candidate method, its evidence and applicability need to be understood. A past human action also needs an explanation; its presence in the record does not make it optimal.
Existing engineering observation: successful calls, missing evidence
In an earlier repository replay of 67 tasks, all 83 performance-tool calls returned success. A later targeted review found one trajectory with seven successful calls and six empty target-detail results.
A successful tool call can leave the system without the evidence it needs to decide. That is what the repository review found through human investigation; the observation does not establish autonomous RSI.
Internal source: performance-tools-v1-v3-rollout-semantic-audit-2026-09-07.md. This article contains an anonymous summary, with no customer traces.
The evaluation covers routine diagnosis and attribution windows, as well as inventory constraints, missing evidence, and conflicting objectives. To pass completely, a decision needs sufficient evidence, a supported conclusion, and an action within the defined constraints. When evidence is missing, waiting or requesting it may pass if that choice is justified. Refusing indiscriminately must not earn a high score.
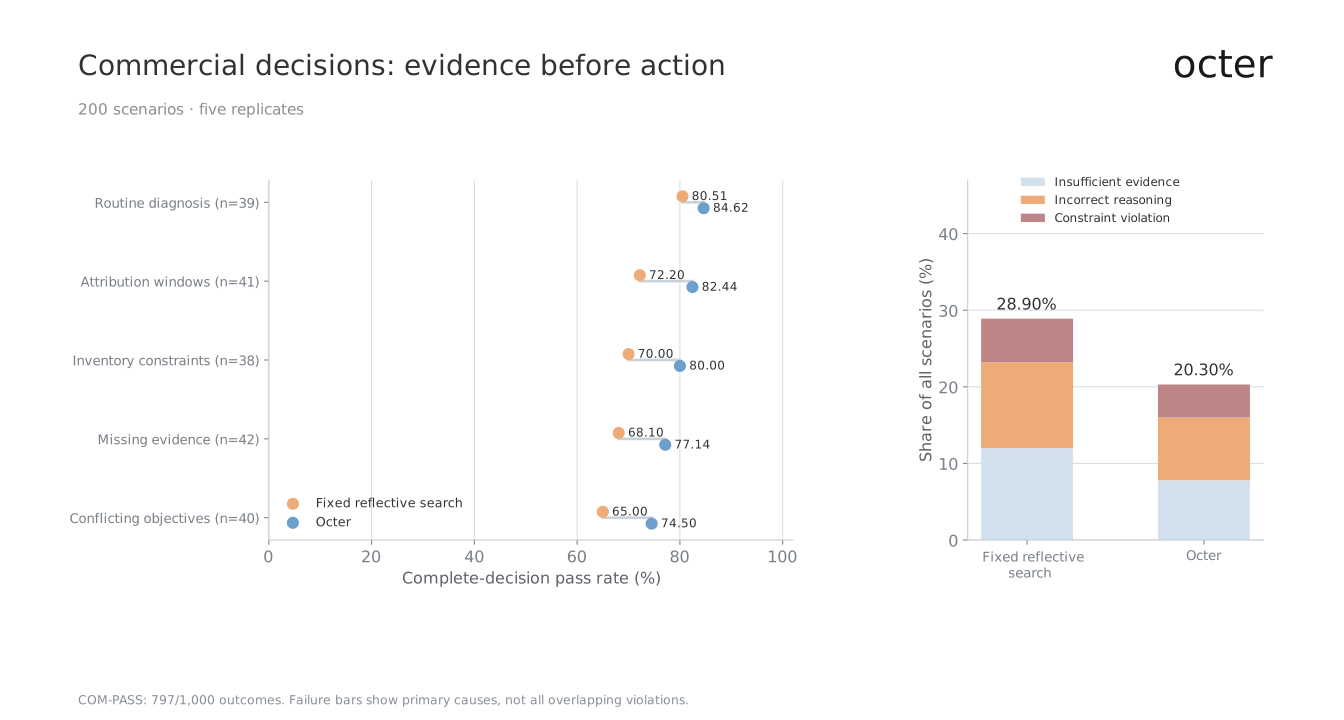
Comparisons across 200 decision slots and five replicates. The category-weighted pass rate is COM-PASS. Each failure has one primary cause; the bars do not count all possibly overlapping violations. Their sum is the complement of the pass rate.
The complete-decision pass rates are 71.10% and 79.70%. COM-PASS counts 797/1000 outcomes across task-replicate pairs, using a rubric different from ENG-PASS. Differences are smaller for routine diagnosis. They are larger where the decision has to reconcile evidence timing with inventory and objectives.
For the full system, constraint violation is the recorded primary failure cause in 4.30% of all outcomes. Each failure receives one cause; the data does not track overlapping violations. This percentage cannot give the total constraint-violation rate, and validating the assignments requires independent adjudication records.
A profit decline might reflect a shift in traffic composition, an inventory limit, or conversions that have not yet matured. Evidence selection separates those explanations before a bounded intervention is considered. The episode keeps track of the hypotheses that survive or fail and the conditions under which the conclusion holds.
An episode like this can inform a method for handling immature attribution windows. At the meta level, it may help improve the choice of evidence under uncertainty. These are two distinct kinds of update. A customer’s stable preference about adjustment size belongs in a separate preference mechanism.
Assessing business impact requires a separate live experiment designed for that purpose. Causal interpretation depends on the experimental units and observation windows, as well as auction interference and concurrent operating changes. We do not convert these offline scores into revenue, profit, or ROAS uplift.
Does the improver itself get better?
The first three studies examine the system performing the tasks. Recursive improvement makes a stronger claim about the processes that modify that system. Comparing those processes requires the task system to start from a fixed initial state.
M0 is the fixed improvement process. M1 is an updated improver, followed by its successor M2. Each can edit failure diagnosis, sample selection, candidate generation, update routing, and budget allocation. To establish autonomous updates, we need generation traces and records of human intervention. Version names identify the comparison conditions but cannot prove authorship.
The recursive claim depends on evidence that M0 generated M1, then M1 generated M2. Scores tell us whether those successors improve adaptation, not who produced them. We assess provenance separately from performance.
Protocol: proving autonomous parent-to-child generation
Freeze the initial improver, model snapshot, allowed tools, generation budget, and promotion rule before generation begins. Run M0 on generation-development tasks, retaining every proposed change, including rejected candidates. The executable changes for M1 must come from M0. Once frozen, M1 must run the process that generates M2. Both transitions use the same immutable promotion rule and generation-selection data to accept a successor, without access to final audit results.
For each transition, keep the parent and child code and configuration hashes, source experience IDs, complete model and tool traces, and the patch. The record also needs validation results, resource usage, and a timestamped log of interventions. Applying the saved patch to the parent must reconstruct the saved child. Hashes identify those artifacts; substantiating autonomous authorship also takes access-controlled execution logs and independent review.
Disqualify a branch from the autonomous-lineage comparison if a person edits it, supplies research hints, or chooses among its candidates. Log infrastructure repairs and safety stops separately, noting whether they changed research behavior. The number of independent lineages and the stopping rule must be declared in advance. Keep failed transitions in the report as well. M labels alone cannot document a lineage.
Before any version encounters the new environments in the meta comparison, freeze the complete lineage. Keep generation data separate from those environments. During evaluation, each improver version stays fixed as it adapts an identical initial task harness within each environment. Repeat lineage generation independently to test whether an improvement can be reproduced beyond a selected branch.
All versions face the same 12 new environments: four in engineering, four in science, and four in commercial work. Within each environment, M0, M1, and M2 share the initial harness state and five paired run indices, giving 60 adaptation records per version. These environments are separate from the task sets in the domain studies.
A run can use up to 240 candidate-task evaluations, each of which checks one candidate on one task. Development checks count toward that total, as do validation checks used to decide whether the threshold has been reached. Candidate generation, model resources, tool compute, and the independent final audit need their own accounting.
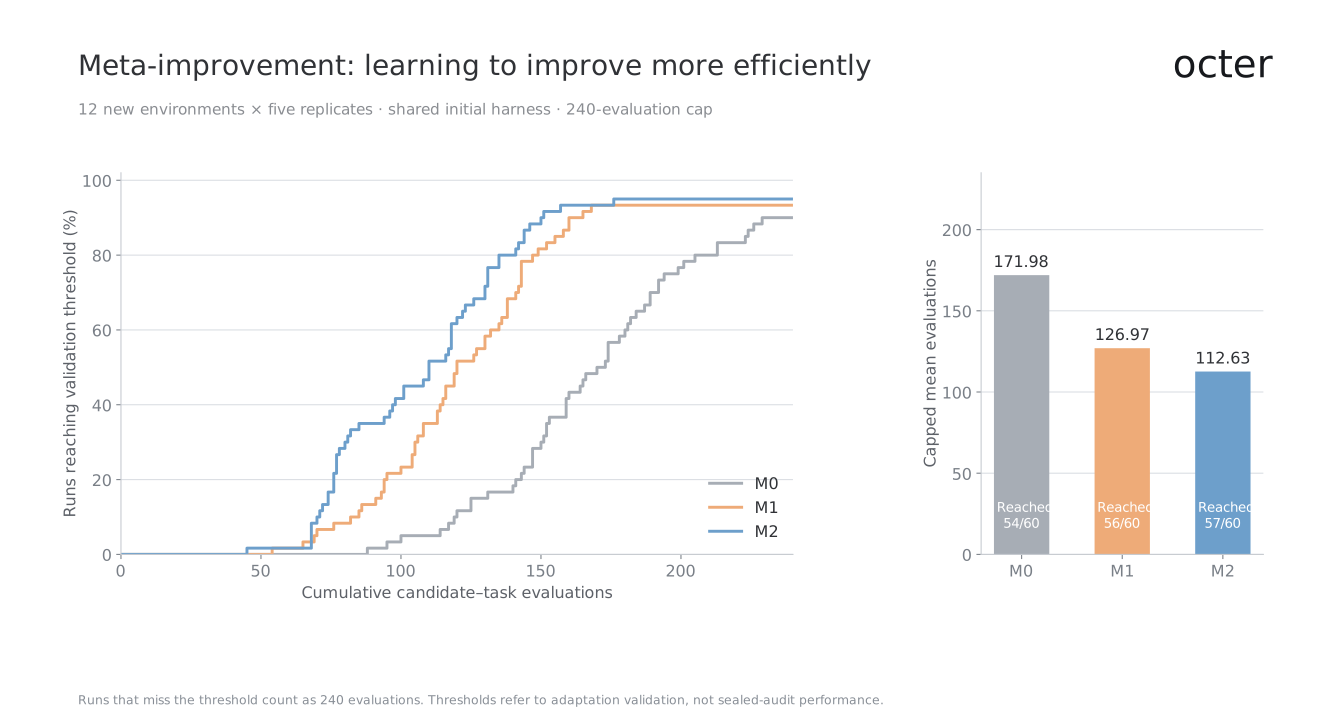
Threshold-attainment curves and capped mean evaluation counts. Misses contribute the full 240-evaluation budget. The threshold concerns adaptation validation; independent final generalization remains a separate measurement.
Thresholds, failed runs, and the sealed audit
To reach the adaptation threshold, the run must improve its environment’s domain-specific pass rate by at least ten percentage points over the initial harness on the adaptation validation set. It must also satisfy separately defined hard constraints. This threshold stops a run; it does not require the differences between methods in the opening table to exceed ten points.
Fix validation-set sizes, checking schedules, and constraints under the protocol, and charge every threshold check to the evaluation budget. The file contains only attainment flags and crossing counts. Without validation-score trajectories or constraint-check histories, this package cannot independently verify those flags.
After adaptation, a separate sealed audit checks final generalization. Its results must stay out of improver updates. The plotted time-to-threshold concerns adaptation validation and does not establish generalization on that sealed audit.
A failed run contributes the full 240 evaluations to the capped mean, so the cost of failure stays in the calculation. Including only successful runs would leave it out. Evaluation counts do not measure dollars, tokens, GPU hours, or deployment latency.
Between M0 and M2, the capped mean drops by 34.51% and threshold attainment increases from 90.00% to 95.00%. The two measures belong together: speed on successful runs can be outweighed by a high failure rate.
To interpret this comparison, we also need sealed-audit generalization, matching model and resource limits, and identical initial task agents. Testing across different task distributions examines how far multi-generation improvement extends.
Understanding what produces the gain
The ablations remove one mechanism at a time: validated experience inheritance, applicability checks on experience, or independent selection validation before retaining a version. Within a domain, every final candidate faces the same sealed standard. An advantage for the full system does not, by itself, show that inheritance caused it.
Figure 7 reuses the domain-study outcomes for its full-system bars. The remaining ablations provide aggregate counts but no paired predictions for individual tasks. These comparisons describe the controls; they cannot establish the effect of a component.
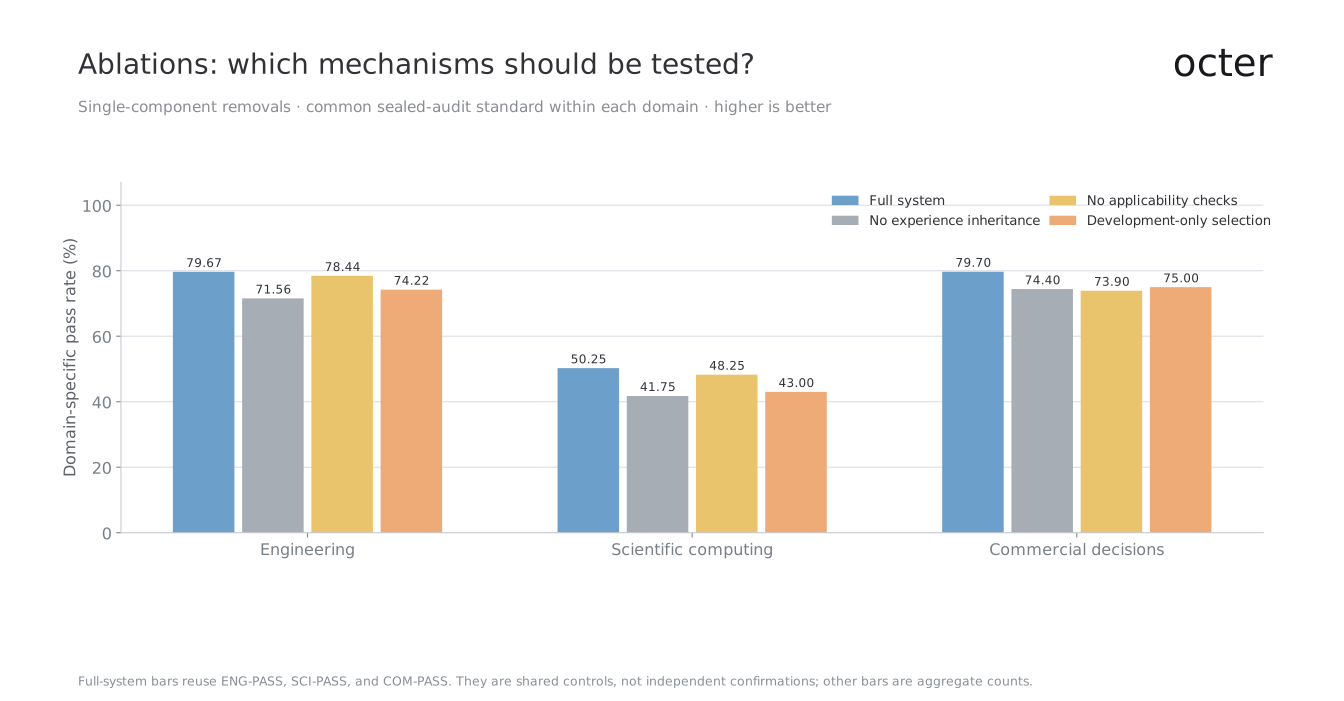
Full-system controls reuse ENG-PASS, SCI-PASS, and COM-PASS, including the same replicate counts. They are not independent replications. Other bars are aggregate counts without task-level paired outcomes. Each domain retains its own criterion; these comparisons do not establish causal effects.
Each of the three removals has a different consequence to examine. Without inheritance, later tasks pay again to discover useful methods. Without applicability conditions, a method that once worked may be used in the wrong situation. And selecting versions solely on development results can produce gains that fail independent review.
Components can interact, so their effects need not add up. A conservative check may help in one domain yet reject useful changes in another. A complete evaluation should count both kinds of mistake: accepting invalid candidates and rejecting valid ones.
Protocol: isolating the effect of inherited experience
Use development data to build a catalog of retained methods, then freeze it before evaluating target tasks. Give one condition access to the catalog and withhold it from the other in paired, isolated runs. Everything else at the start must match: the remaining harness, raw experience retrieval, base model, tools, meta-improver, editing permissions, and resource ceilings. Both conditions may discover methods within the same budget. Randomize their execution order and prevent them from sharing memory or caches.
A further control has a catalog of the same size and interface, filled with unrelated but valid methods selected without target-audit access. It tests whether extra context or access to more tools explains the difference. Alongside budget ceilings, record token and tool usage. Account for the cost of acquiring the inherited catalog separately.
The primary effect is the paired difference in domain-specific pass rate on held-out tasks. Declare the task split, independent run count, minimum effect of interest, and analysis in advance. Uncertainty estimates must retain task-template or source-group clustering and dependence between paired runs. Multiple outcomes for one task cannot count as independent tasks.
To examine a particular mechanism, choose inherited methods in advance using development evidence. Remove one from an otherwise fixed snapshot, then restore that exact artifact in a paired condition. Record its source trajectory, applicable tasks, actual use, and outcomes for each task. If performance falls on removal and recovers on restoration, that supports a specific causal contribution under these controls. Usage traces alone establish association. Figure 7 contains no such intervention records, and we assign no new causal-effect values here.
A development judge may identify failure types and propose checks. Selection validation determines which versions the full system keeps; the development-only ablation deliberately skips this step. The sealed audit checks frozen versions against domain constraints and external outcomes without selecting or improving them. Changes to scoring standards require historical candidates to be rescored against a common standard on a fresh audit partition.
Protocol: checkpoints without audit feedback
Before search starts, register separate development, selection-validation, and sealed-audit partitions, keeping template and source groups together. Freeze the model snapshots, tool access, scoring code, and resource limits. Stopping rules, the checkpoint schedule, and the final-candidate selection rule must also be fixed. For meta evaluation, each new environment provides adaptation-development and adaptation-validation data. Its final audit partition stays separate.
Search may draw on development and selection-validation feedback. Save an immutable snapshot of code, instructions, memory, skills, and configuration at every scheduled checkpoint. Use the registered validation rule to select the final candidate. Before running any audit, freeze all lineages, methods, ablations, checkpoint snapshots, and reporting decisions in a timestamped manifest. Report missing checkpoints, failures, and protocol deviations along with other outcomes.
An independent runner evaluates the frozen snapshots. For each audit task, the task agent receives only the required inputs and tool responses. It cannot see hidden labels or the scorer, invoke the improver, or carry persistent updates into other audit tasks. The runner is separated from development through isolated storage, restricted network access, and access logs. While the experiment remains open, agents and researchers choosing candidates must receive no audit scores, errors, outputs, or intermediate summaries.
Audit results are released only when every registered candidate and checkpoint has been evaluated under the manifest and the experiment is closed. Figure 2 looks back at the predeclared checkpoints, regressions included. The candidate chosen before audit supplies the headline result. Audit scores may not select a checkpoint, stop search early, generate a patch, or alter a promotion decision. The meta stopping threshold still uses adaptation validation, and every check counts against its budget.
If audit information reaches search or selection, log the breach and treat affected results as exploratory. Any further development needs a fresh, untouched audit partition for confirmation. Publication likewise retires an exposed partition from subsequent confirmation. Review the isolation controls and their access logs: a written protocol alone cannot establish that feedback leakage was prevented.
Related work addresses several parts of this problem. Recursive brings candidate validation and audits for evaluation exploits into automated research. GEPA studies optimization through trajectories and reflection, while Hyperagents examines systems whose task agent and improver can both be edited. Assessing Octer’s claims likewise requires explicit tasks and budgets, a record of changes, and independent outcomes.
Accounting for the cost of learning
The experiments used to develop a better improver have an upfront cost. That investment belongs in any calculation of whether the improver saves effort on later adaptation.
Our cost calculation assumes 2,000 upfront evaluations for M1 and 3,800 cumulative upfront evaluations for M2. Using the capped means and a stable distribution of subsequent tasks, M2 recovers its assumed extra upfront cost over M0 after about 65 adaptation episodes. Against M1, the corresponding point is about 126.
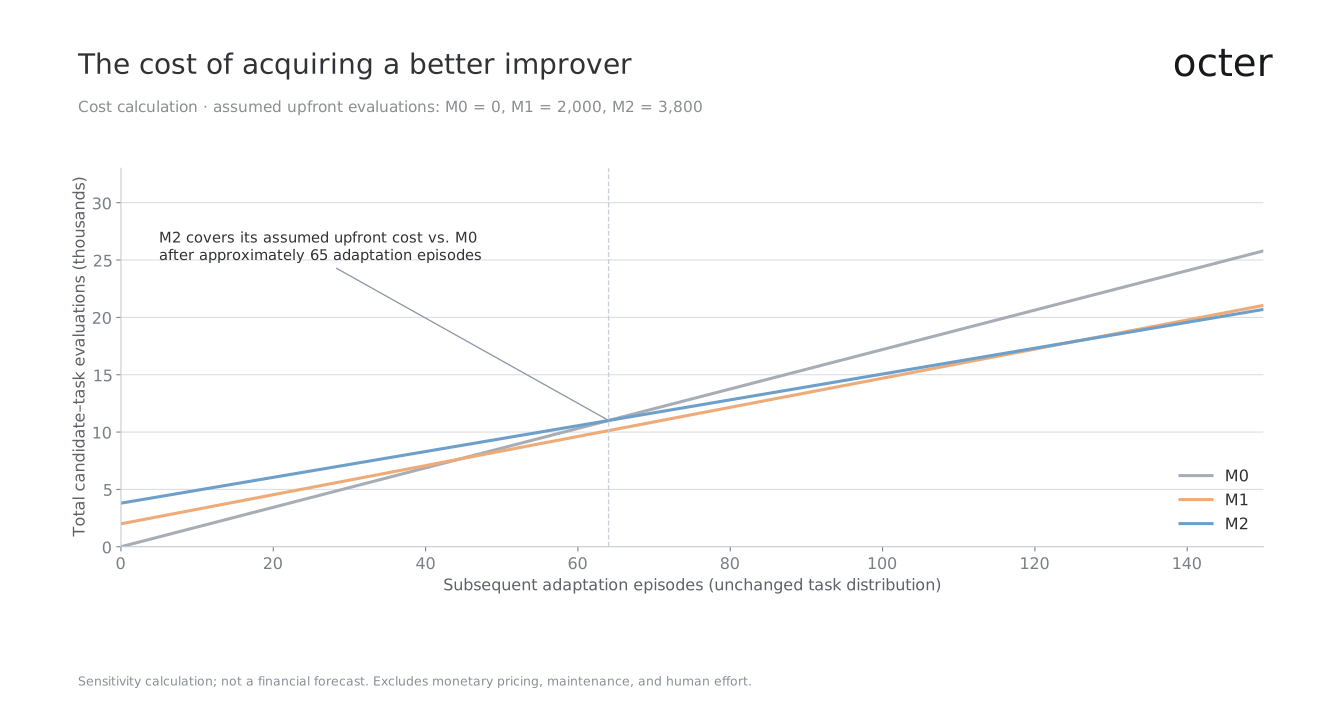
An arithmetic sensitivity calculation using assumed upfront costs and capped means. The projection assumes a stable task distribution and excludes monetary pricing, maintenance, and human effort. It is not a financial forecast.
This calculation asks whether accumulated experience reduces the marginal effort of adapting to later tasks. Frequent environmental changes or expensive method maintenance could prevent recovery of the upfront cost. Gains confined to a narrow task family could do the same. Monetary pricing, maintenance, and human effort are excluded from the calculation, so it is not a forecast of financial returns.
What comes next
Advertising can provide persistent tasks, executable actions, and feedback for this research. For that experience to remain useful over time, it has to become methods supported by evidence, with a defined scope and a way to test them again.
Engineering and science test how far the learning process reaches. The domains share trajectory handling, experiment selection, and version validation, but each retains its own knowledge, resource constraints, and external standards. An organization should be able to inspect, update, disable, and move its facts, preferences, and experience. Sharing methods requires authorization and transfer validation.
Further research includes domain models, new tools and analysis programs, and experimental infrastructure. These directions need evaluation of prediction quality, experiment selection, and recalibration against observed conditions.
We want businesses, scientific teams, and engineering organizations to own systems that keep improving through their work. These studies let us test that aim and present the evidence. Failures and uncertainty must remain in the evaluation alongside gains, and each claim needs support from execution records.
Methods and data
The article includes eight vector figures and downloadable English-language chart data. Each figure can be enlarged, and the underlying data can be downloaded below.
Data structure and reproducibility
One data package supplies all the values: task-level outcomes, engineering checkpoints, meta threshold records, ablations, and amortization calculations. It contains 11,000 task-level records across the comparison conditions. Downloads include task identifiers and the fields used to calculate the charts.
The 11,000 rows break down into 5,400 engineering outcomes (180 tasks × five replicates × six conditions), 1,600 scientific outcomes (80 × five × four), and 4,000 commercial outcomes (200 × five × four). Across them are 460 distinct task IDs; 11,000 is not a count of independent tasks.
The remaining files hold 260 engineering checkpoint summaries, 180 meta adaptation records, 60 ablation summaries, and 453 arithmetic projections. These counts describe different kinds of records, and the full-system ablation controls reuse the domain outcomes. Adding the counts together would not give an independent experimental sample size.
Task IDs index the records. Reproducing an agent experiment also takes executable task definitions, source observations, model outputs, and experiment traces. Having five replicate indices does not establish that the runs are independent. Their ranges are not statistical confidence intervals.
Download all embedded dataControls, sample sizes, and resource accounting
Model snapshots, data partitions, tool capabilities, per-task limits, optimization budgets, and scoring versions must be fixed for the study. The final sets have 180 engineering tasks, 80 scientific problems, and 200 commercial scenarios. Whether these sizes suffice depends on pilot variance and the predefined effect of interest. Analysis should account for grouping by task or environment.
The engineering optimization ceiling is 60M tokens. It covers the improver, development task executions, and model-based evaluation; tool compute, final audits, and deployment inference are accounted for separately. Scientific experiments need fixed limits on candidate computation. Commercial experiments need fixed data cutoffs and action boundaries. Include the model snapshots and hardware specifications in the execution record.
Fixed reflective search is a control designed around trajectory feedback, candidate evaluation, and a fixed search procedure. Its scores do not report GEPA, Recursive, or any other third-party system’s performance. Suitable public methods should also be included with matching editing scope and resource budgets.
Reading differences, error bars, and cost projections
We calculate differences, failure reductions, and amortization points from unrounded values before formatting them for display. Percentages and capped evaluation means use two decimal places. Axis ticks, counts, and budget caps keep their natural scale. Because differences are calculated before rounding, they can differ by 0.01 from a subtraction of the displayed values. The extra digits distinguish values without implying statistical certainty. Error bars and bands represent replicate ranges, not confidence intervals.
ENG-PASS is 717/900, or 79.67% as displayed. COM-PASS is 797/1000, displayed as 79.70%. Both read 79.7% in the earlier one-decimal edition, although the metrics and underlying ratios differ. Their proximity near 80% is neither evidence of cross-domain equivalence nor a statistical finding.
Categories differ slightly in size, and replicates have different outcome counts. Overall pass rates pool the task outcomes using the category sample sizes shown in the charts as weights. The decimal values come from those counts.
Pass conditions are specific to each domain; we do not combine scores into a general-intelligence metric. Meta threshold counts concern adaptation validation, with no sealed-audit meta score included. Failed runs contribute the full cap. The upfront costs of 2,000 and 3,800 evaluations are assumptions used for arithmetic sensitivity.